
Everything application developers need is found in this development system for Windows, Linux, and macOS. Access to native system functions is easy. The Forth programming language is the high-performance foundation of this full-featured, interactive development environment.
On This Page
Overview
SwiftForth brings the fast, powerful, ANS Forth programming language to Windows, Linux, and macOS.
Highlights
- No need for an external compiler, assembler, or linker.
- Easy access to all system functions and dynamic libraries.
- Includes SWOOP™, a powerful object-oriented Forth programming system.
- Command window provides interactive development environment.
- Simple linking to the programmer’s editor of your choice.
- Advanced debugging features include built-in cross reference, source browser, and disassembler/decompiler.
- Powerful rule-based optimizing compiler.
Documentation
After installation, the full SwiftForth documentation (all in PDF format; requires Adobe Reader) will be located in the SwiftForth/doc directory. The documentation consists of:
- SwiftForth Reference Manual
- ANS Forth Standard
- Forth Programmer’s Handbook
Complete source code
The fully licensed version of SwiftForth includes complete source, including the kernel, Interactive Development Environment (IDE), and all features.
SwiftForth also includes the cross compiler, which compiles the kernel, so you can customize the kernel to your needs.
System requirements
These are the OS-specific requirements for SwiftForth:
- GUI IDE for Windows: Windows 10 or later
- Command-line IDE for macOS: Mac OS X 10.6 through macOS 10.14 (requires 32-bit library support)
- Command-line IDE for Linux: Linux 4.4 kernel or later (requires i386 32-bit library support)
SwiftForth requires an i386-compatible CPU. If you’re looking for something for your Beaglebone, Raspberry Pi, or other embedded ARM Linux board, check out SwiftX-ARM for Linux targets.
Forth Implementation Features
SwiftForth is designed to produce optimal performance. This section describes the implementation of the Forth virtual machine, and will be of interest to experienced Forth programmers.
Execution model
SwiftForth is a 32-bit, subroutine-threaded Forth system running as user application under Windows, Linux, and macOS.
Subroutine threading is an implementation strategy in which references in a colon definition are compiled as subroutine calls. SwiftForth substitutes direct code in place of subroutine calls wherever possible for efficiency.
Colon and code definitions do not have a code field distinct from the content of the definition itself; data structures typically have a code field consisting of a call to the code for that data type. At the end of a colon definition, the conventional EXIT is replaced by a subroutine return (or by tail recursion).
The nature of a subroutine-threaded implementation lends itself to inline code expansion. SwiftForth takes advantage of this by having a header flag that indicates if a word is to be compiled inline or called. The compiler will automatically inline a definition whose INLINE field is set. Many of the kernel-level CODE words are marked to be inlined.
SwiftForth’s CPU register usage
| Register | Purpose |
|---|---|
| EBX | Top of stack |
| ESI | User area pointer |
| EDI | SwiftForth memory base address (origin) |
| EBP | Data stack pointer |
| ESP | Return stack pointer |
All other CPU registers are available for use without saving and restoring.
Memory model
SwiftForth runs in a single, contiguous, flat 32-bit address space. SwiftForth is position independent, which means it can run wherever the host OS has loaded it without having to keep track of where that is.
By being position independent, SwiftForth simplifies and speeds up interactions with the host environment. This feature is a natural consequence of subroutine threading, because i386 call instructions use relative addresses. Forth execution tokens are relative to the start of the run-time memory space, but they are used only internally and do not need conversion. All data objects that return addresses return full absolute addresses that can be passed to the host OS, if desired, without conversion.
Dictionary features
The SwiftForth dictionary can accommodate word names up to 254 characters in length. Wordlists are multithreaded via a hashing mechanism to speed up the dictionary search process. Wordlists in SwiftForth may have any number of threads; the default number of threads is 31.
ANS compliance
SwiftForth was implemented for ANS Forth compliance, and includes a copy of the Hayes compliance test suite. The Core, Core Extensions, Blocks, Double Number, Exception, Facility, File Access, Floating Point, Memory Allocation, Programming Tools, Search Order, and String wordsets are complete except for words marked obsolescent. A Local Variables wordset is provided that is compliant except for argument order.
Text and block-file support
The interpreter will handle both text and block files.
For text files, the system provides for linking to an arbitrary external editor. LOCATE is fully supported for both text and block files, displaying a portion of source in the command window with an option to switch to an external editor. The normal LIST method is used for block files.
Assembler and disassembler
A postfix assembler and disassembler are supplied. The assembler supports the required set of Intel-defined operations and addressing modes. Except for the ordering of arguments, it is essentially identical to Intel notation. Structured conditionals (IF, THEN, etc.) are implemented.
The disassembler can decompile high-level Forth words as well as CODE definitions.
Local variables
SwiftForth provides a local variables implementation that is compatible with ANS Forth. Local variables in SwiftForth are instantiated on the return stack.
Floating-point math
SwiftForth includes good support for floating-point math. Use of the hardware FP stack is optional (e.g., use it for optimum speed when you don’t require more than about six or seven floating-point values on the stack at a time).
SwiftForth includes the ANS Forth floating-point wordset, plus high-level words for trig, log and exponential functions, and words for defining and displaying matrices. Input and display formats are configurable.
SwiftForth also includes the entire Forth Scientific Library, with the required compatibility layer. Information about the contents of this library may be found at https://www.taygeta.com/fsl/scilib.html.
Optimizing Compiler
SwiftForth includes a powerful rule-based optimizing compiler.
As noted previously, SwiftForth uses inlined code and tail recursion to increase efficiency. More extensive optimization is provided by a powerful rule-based optimizer that can optimize hundreds of common high-level phrases. This optimizer is normally enabled, but can be disabled for debugging or comparison purposes.
For example, consider the definition of DIGIT, which converts a small binary number to a printable character:
: DIGIT ( u -- char) DUP 9 > IF 7 + THEN [CHAR] 0 + ;
With the optimizer disabled, the following code is generated (displayed here using the SwiftForth disassembler):
   SEE DIGIT
   47170F   4 # EBP SUB                    83ED04
   471712   EBX 0 [EBP] MOV                895D00
   471715   4 # EBP SUB                    83ED04
   471718   EBX 0 [EBP] MOV                895D00
   47171B   9 # EBX MOV                    BB09000000
   471720   403A8F ( > ) CALL              E86A23F9FF
   471725   EBX EBX OR                     09DB
   471727   0 [EBP] EBX MOV                8B5D00
   47172A   4 [EBP] EBP LEA                8D6D04
   47172D   471744 JZ                      0F8411000000
   471733   4 # EBP SUB                    83ED04
   471736   EBX 0 [EBP] MOV                895D00
   471739   7 # EBX MOV                    BB07000000
   47173E   0 [EBP] EBX ADD                035D00
   471741   4 # EBP ADD                    83C504
   471744   4 # EBP SUB                    83ED04
   471747   EBX 0 [EBP] MOV                895D00
   47174A   30 # EBX MOV                   BB30000000
   47174F   0 [EBP] EBX ADD                035D00
   471752   4 # EBP ADD                    83C504
   471755   RET                            C3
With the optimizer enabled, the benefits are obvious:
   SEE DIGIT
   47170F   9 # EBX CMP                    83FB09
   471712   47171B JLE                     0F8E03000000
   471718   7 # EBX ADD                    83C307
   47171B   30 # EBX ADD                   83C330
   47171E   RET                            C3
Programming Tools
Command-line editing and history
When you type in the command window, SwiftForth will wait to process what you’ve typed until you press the Enter key. Before pressing Enter, you may backspace or use the left- and right-arrow keys to edit your command line. The up- and down-arrow keys page through a buffer of previous command lines.
The SwiftForth command-line processor also implements tab completion. Pressing the Tab key after typing a few characters repeatedly completes the line from matching patterns in the command history buffer.
Integrated source browsing
You view the source for any word in the current search order by typing LOCATE <name>. This displays the line in the source on which the word appears, with several lines after it as well as the file in which the source is located and the line numbers of the lines displayed. Here’s an example:
LOCATE WORD
C:\ForthInc\SwiftForth\src\kernel\parser.f
   33: : WORD ( char "ccc" -- c-addr )
   34:    /SOURCE OVER >R   2 PICK  SKIP DROP R> - >IN +!
   35:    /SOURCE DROP 'TIB @ - IN> !  PARSE  DUP IN> CELL+ !
   36:    HERE C!  HERE COUNT CMOVE  HERE ;
Link to your favorite source editor
You may invoke your linked editor — for the word whose source was most recently displayed by LOCATE word — by typing EDIT. The editor will be launched and open with the correct source line selected.
Alternatively, you can type EDIT <name> to open the editor positioned at the line with the definition of name.
Cross-reference command
SwiftForth provides a cross-reference tool that enables you to find all references to a word. To find all the places a word is used, type:
WHERE <name>
This displays the first line of the definition of name, followed by each line of source code in which name is referenced in the currently loaded code. If there are multiple definitions with the same name, WHERE will list each definition and the references to it separately. The shortcut:
WH <name>
does the same thing. This command is not the same as a source search; it is based on the code that is loaded right now. This means you will be spared any instances of name in files you aren’t using and can see redifinitions and their respective references.
Debugging Tools
Disassembler and decompiler
SwiftForth includes a disassembler that can be used to generate human-readable source code from compiled definitions. This is useful as a cross check, whenever a new definition fails to work as expected, and also shows the results of SwiftForth’s optimizing compiler. By disassembling a definition, you can see exactly what instructions were generated by the compiler.
The single command SEE <name> disassembles the code generated for name.
For example, the definition of TIMER is:
: TIMER ( u -- ) COUNTER SWAP - U. ;
It disassembles as follows:
   SEE TIMER
   47170F   45B2AF ( COUNTER ) CALL        E89B9BFEFF
   471714   0 [EBP] EBX SUB                2B5D00
   471717   4 # EBP ADD                    83C504
   47171A   40916F ( U. ) JMP              E9507AF9FF
The left column shows the memory location being disassembled. This is followed by the instruction (or data) at that location. Note that the disassembler attempts to match named locations in memory with their addresses. The right column shows the actual bytes in memory.
Single-step debugger
A simple single-step debugger allows you to step through code compiled from a source file. Here is a simple example:
   [DEBUG
   : 2X ( n1 -- n2 )   DUP + ;
   : 3X ( n1 -- n2 )   DUP 2X + ;
   : 4X ( n1 -- n2 )   DUP 2X SWAP 2X + ;
   : 5X ( n1 -- n2 )   DUP 3X SWAP 2X + ;
   DEBUG]
Assuming this source has been compiled, you may type 4 DEBUG 5X to enter the single-step debug loop.
At each step, the source line is displayed with the next word to be stepped through highlighted. After this, the current data stack is displayed (in the familiar .S format) along with a prompt for the next step:
- Nest executes the next word, nesting if it is a call.
- Step executes the next word, with no nesting.
- Return executes to the end of the current (nested) definition without stopping.
- Finish executes to the end of the top-level definition without stopping.
SWOOP: Object-Oriented Forth Programming
SwiftForth includes a powerful object-oriented Forth programming package called SWOOP. SWOOP provides the essential features of object-oriented programming.
- Encapsulation: combining data and methods into a single package that responds to messages.
- Information hiding: the ability of an object to possess data and methods not accessible outside its class.
- Inheritance: the ability to define a new class based on a previously defined (parent) class. The new class automatically possesses all members of the parent; it may add to or replace these members, or define behaviors for deferred members.
- Polymorphism: the ability of different sub-classes of a class to respond to the same message in different ways. For example, adding a pair of scalars is different from adding a pair of vectors.
SwiftForth’s support of object-oriented programming is extensive and powerful. The following brief introductory information is excerpted from the SwiftForth Reference Manual.
POINT (defined below) is a simple class we shall use as a primary building-block example for SWOOP. It demonstrates two of the four basic class member types: data and colon. The word following CLASS is the name of the class; all definitions between CLASS and END-CLASS belong to it. These definitions are referred to as the members of the class. When a class name is executed, it leaves its handle (xt) on the stack. The constructor words are the primary consumers of this handle.
    CLASS POINT
	    VARIABLE X
	    VARIABLE Y
	    : SHOW ( -- )   X @ . Y @ . ;
	    : DOT ( -- )   ." Point at " SHOW ;
    END-CLASS
The class definition itself does not allocate any instance storage; it only records how much storage is required for each instance of the class. VARIABLE reserves a cell of space and associates it with a member name.
The colon members SHOW and DOT are like normal Forth colon definitions, but are only valid in the execution context of an object of type POINT. X and Y also behave exactly like normal VARIABLEs in the Forth programming language.
There are five kinds of members:
- Data members include all data definitions. Available data-member defining words include CREATE (normally followed by data compiled with , or C,), BUFFER: (an array whose length is specified in address units), VARIABLE, CVARIABLE (single char), or CONSTANTs.
- Colon members are definitions that may act on or use data members.
- Other previously defined objects, available within this object.
- Deferred members are colon-like definitions with default behaviors that can be referenced while defining the class, but which may have substitute behaviors defined by sub-classes defined later. These allow for polymorphism and late binding.
- Messages are unnamed responses to arbitrary numeric message values.
Objects may be static or dynamic. Both early and late binding are supported. Instance data and methods are implemented in a manner that is very efficient in the context of a Forth development environment.
Libraries, Functions, Callbacks, and Threads
Because SwiftForth was designed from the outset as a hosted system, great care has been given to make the interface to system and library functions as clean and easy to use as possible, given the inherent complexity of the OS environment.
Easy access to system functions via dynamic libraries
System functions in Windows, Linux, and macOSare provided to an application program via the dynamic library mechanism. SwiftForth supports a simple library function import mechanism that is based on the C function prototype.
Before referencing a function in a library, you must first open the library:
LIBRARY <name>
Any function in a library may be made available as a Forth word:
FUNCTION: <name> ( params -- result )
…where name is the (case-sensitive) published function name, params represents the list of parameters passed to the library function and the (optional) result is the returned value. Parameters are provided on the stack in the order described in the function prototype, so it’s easy to reference the function from a Forth program.
Both C-prototype and Pascal-prototype library functions may be called; SwiftForth passes the parameter stack to the external functions automatically. Functions with identical names from different libraries may be invoked without name collision via an alias mechanism. Lists of currently attached libraries and their imported functions may be displayed in the debug window at any time.
Here is an example of the import of the Windows global memory allocation function from Kernel32.dll:
   LIBRARY Kernel32
   FUNCTION: GlobalAlloc ( uFlags dwBytes -- h )
This is the import of the Linux heap memory allocation function from libc:
   LIBRARY libc.so.6
   FUNCTION: malloc ( u -- addr )
The macOS version is nearly identical to the Linux one:
   LIBRARY libc.dylib
   FUNCTION: malloc ( u -- addr )
System callbacks
A callback is an entry point into your program. It is provided for the OS to call in certain circumstances to pass messages or signals to your program.
A callback is much like an interrupt in other programming environments, in that the code that responds to it is not executing as a sequential part of your application. In SwiftForth, callbacks are handled by a transient “task” with its own stacks and user area; it exists only for the duration of the callback function. Callbacks may execute any reentrant SwiftForth words, but may not directly communicate with the running program other than by storing data where the program may find it.
You may define a callback with any number of parameters, using the form:
<xt> <n> CALLBACK: <name>
…where xt is the execution token of the routine to respond to the callback, and n is the number of parameters passed to the callback.
A callback must always return a single integer result, which is used as the return value from the callback function. The defining word CB: wraps the execution of the xt with the necessary code to construct and discard the transient task environment in which the callback runs. Executing name returns the address to pass to the OS (e.g., as a message or signal handler).
Multitasking with threads
SwiftForth provides a simple facility for defining and activating tasks which are themselves threads within the SwiftForth program. A thread is similar to the background task of other Forth implementations in that it is given its own Forth stacks and user area and is executing code from within SwiftForth’s dictionary space.
IDE for Windows Programming
System messages
System messages are handled via a compiled switch mechanism, which can be easily extended to include any new messages that need to be handled. For example, this is the code to extend the standard existing Windows message handler SFMESSAGES to include keystroke events:
   [+SWITCH SFMESSAGES
      WM_SYSKEYDOWN     RUNS KDOWN1
      WM_KEYDOWN        RUNS KDOWN0
      WM_CHAR           RUNS CDOWN0
      WM_SYSCHAR        RUNS CDOWN1
    SWITCH]
Windows dialogs
Dialog boxes are supported via a simple dialog compiler, which parallels the Microsoft resource compiler. SwiftForth’s console debugging tool can be used to trace the execution of Windows dialog box code.
Making DLLs and exporting functions
In SwiftForth, it is a simple matter to create Windows DLLs with exported functions. A DLL made from SwiftForth contains the entire system. Any program capable of calling DLL-based functions may import the exported functions.
DDE support
SwiftForth includes optional DDE client services, including a simple set of user words for sending or requesting data:
TELL sends a string to an item on the server and ASK gets an item from the server. For example:
   SERVER PROGMAN
   TOPIC PROGMAN
   ASK GROUPS
Menu definition and execution
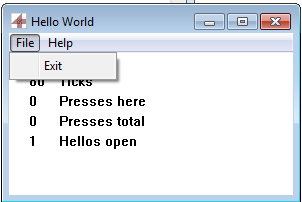
SwiftForth provides a simple means of defining menus and relating menu items to Forth words. The mechanism provides for context-sensitive item execution by the user, and is easily extensible by simply defining a Forth name that directly corresponds to the menu text. For example, the “Hello World” demo in the figure shown here includes File and About menus, defined by:
    MENU HELLO-MENU
        POPUP "&File"
            MI_EXIT MENUITEM "E&xit"
        END-POPUP
       POPUP "&Help"
            MI_ABOUT MENUITEM "&About"
        END-POPUP
    END-MENU
Behaviors may be attached using extensible switch structures. The menu items MI_EXIT and MI_ABOUT defined in the above popups may be assigned behaviors like this:
    [SWITCH HELLO-COMMANDS ZERO
       MI_EXIT  RUN: ( -- res )   HELLO-CLOSE 0 ;
       MI_ABOUT RUN: ( -- res )   HELLO-ABOUT 0 ;
    SWITCH]
The code following the RUN: is an unnamed definition attached to the respective menu item. A named word that is already defined may also be attached by replacing RUN: with RUNS <name>.
Exception handler
Windows exceptions, which are caught by the standard exception filter, are trapped, logged, and generate a simple Forth THROW which the user can capture and handle. Errors during callbacks are also caught and handled.
SwiftForth Programming Language References
Windows API Reference

MSDN Library
This portion of the MSDN Library contains essential resources for developing with Win32. Use the Search box to quickly find details for specific Win32 API calls.
Intel® 64 and IA-32 Architectures
Software Developer’s Manuals
Intel® 64 and IA-32 Architectures Software Developer’s Manuals describe the architecture and programming environment of the Intel® 64 and IA-32 processors.